- 1 reply
- 1,851 views
- Add Reply
- 0 replies
- 1,635 views
- Add Reply
- 4 replies
- 2,972 views
- Add Reply
- 0 replies
- 1,497 views
- Add Reply
SQL Server: How to create Wedge (ST_Geometry)
By arso,


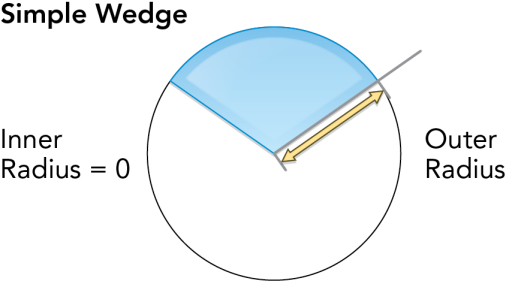
I want to create a Wedge in SQL server without using any mapping tool like ArcMap, which will be visualized (only) in ArcGIS. Unfortunately, ST_Geometry is not supported in SQL Server and CircularString is not supported in ArcGIS.
I assumed to create a buffer around a point but my actual requirement is just a wedge (partial circle with start and end angles).
For Example, for parametric wedges in PostgreSQL/PostGIS
sde.st_geometry (x, y, z, m, startangle, endangle, outerradius, innerradiu
UAS Survey of a Mountain Highway in Macedonia
By ptapken,
View this survey video with the Trimble UX5 HP and many other videos and case studies on Geo-matching.
Why MSS or SPOT-HRV does not have the "blue band"
By lybinhan1,
Somebody please help me. I have a question that why the "blue band" was not included in SPOT-HRV sensor?
On Landsat 4 - TM sensor which have "blue band" from 1982. Why SPOT-1 (1986) and even SPOT-6 (2004) does not have "blue band". The bue band is important which is used to monitor sediment in water, mapping coral reefs, and water depth. So why they did not make that band in SPOT? Is it difficult to make or something? Please help me. Thank you.
How to make android apps about college bus tracking?
Habitat Classifcation
By ROC,
Hi all. To start off I am fairly new to all of this so this question may not be very clear. Any ideas you can give me will be great. I am trying to classify habitat on my rural study site. I have 2014 1 m resolution aerial photography available to me. I would like to separate habitat categories into woody (trees, shrubs, etc.), a heavy and light herbaceous vegetation category (very thick grass vs. sparse grass/forbs), and bare ground (mostly bare with some vegetation growth). I've been advised t
-
Forum Statistics
8.7k
Total Topics43.4k
Total Posts


